AI Intelligence Platform
OMIKINA
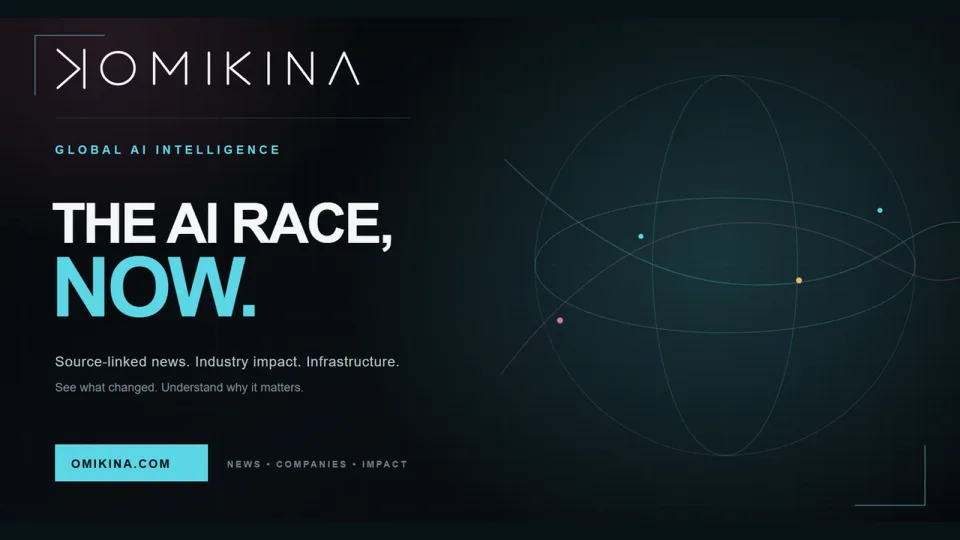
A global AI intelligence platform for understanding the companies, countries, infrastructure, and evidence shaping the machine era.
- Ownership
- Founder, CEO, Product Designer and Developer
- Current status
- Live founder-led public intelligence platform in active development.
- Designed for
- Executives, policymakers, communities, researchers, investors, and people investigating the physical systems beneath AI.
- Case study
- 2 min read
Executive summary
The decision brief
Ownership, the central tradeoff, collaboration boundaries, and what the current record supports.
-
01 Role
Founder, CEO, Product Designer and Developer
-
02 Key decision / tradeoff
Model the physical dependencies beneath AI and keep sourced facts, company claims, inference, delivery status, editorial interpretation, and scenarios visibly separate—even when that makes the interface less reductive.
-
03 Collaboration boundary
Founded and led by John N. Farmer across company strategy, research, product design, editorial systems, and implementation. Automated discovery supports review; it is not presented as verified intelligence or a substitute for editorial judgment.
-
04 Current evidence
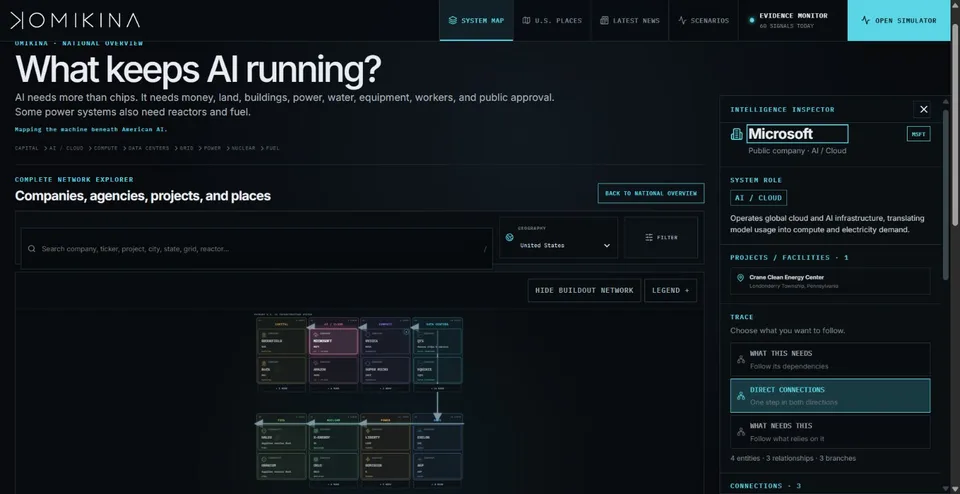
The public platform exposes live maps, company and country profiles, typed relationships, evidence labels, infrastructure views, and a reviewed evidence monitor. Those artifacts demonstrate the system and method, not audience adoption or decision impact.
Documented period · 2026–Present
Scope & evidence
Outputs, evidence, and limits
Outputs describe what was made or delivered. The evidence boundary below states what has—and has not—been validated.
Responsibilities
- Company, product, and editorial strategy
- Global research and evidence modeling
- Interaction and interface design
- Full-stack implementation
- Geographic and network data visualization
- Editorial intelligence and evidence monitoring
- Brand identity and launch direction
- Testing, accessibility, and deployment
Documented outputs & delivery record
- Expanded a rigorous U.S. infrastructure atlas into a global intelligence platform for comparing the companies and countries shaping AI.
- Built an explorable system connecting compute, data centers, chips, grids, power, fuel, capital, policy, agencies, communities, and physical projects.
- Separated sourced facts, company-reported claims, inference, project status, editorial interpretation, and illustrative scenarios so uncertainty remains visible.
- Created a continuously refreshed evidence monitor with reviewed publication boundaries instead of presenting automated discovery as verified intelligence.
Visual archive
Selected visuals
4 selected images from the project archive.



Full story
How the work took shape
Making the machine era visible
AI is usually described through models, benchmarks, and software. OMIKINA starts one layer lower: every prompt depends on physical machines inside real buildings, and those buildings depend on chips, cooling, electricity, grid capacity, land, equipment, workers, financing, policy, and public permission.
I founded Omikina, Inc. and created OMIKINA to turn that hidden system into public intelligence. What began as a rigorous atlas of American AI infrastructure now provides a global view of the companies, countries, resources, projects, and decisions shaping the machine era.
The experience begins with orientation, then opens into explorable maps, comparisons, company and country profiles, evidence, physical projects, and typed relationships. Its purpose is not to make complexity disappear. It is to make the system navigable without hiding uncertainty.
From a U.S. atlas to a global intelligence layer
The U.S. infrastructure atlas remains a foundational layer. Its national overview explains the physical chain beneath AI in plain language, while the full-network explorer preserves companies, agencies, infrastructure, facilities, communities, and evidence as drilldown detail.
The current platform extends that method globally. People can move among country landscapes, company intelligence, infrastructure systems, markets, and current reporting while retaining the underlying evidence trail. The design supports a fast executive overview and deeper investigation without flattening every subject into one score or one map.
Evidence before certainty
Infrastructure announcements often mix operating facilities with proposed campuses, company targets, regulatory reviews, and editorial inference. OMIKINA keeps those concepts separate.
Evidence can be labeled sourced, company-reported, inferred, or illustrative. Project delivery status is recorded independently, so a well-sourced project can still be proposed, under construction, or awaiting approval. Geographic views state their coverage rather than claiming to be complete inventories.
That restraint is part of the product design. A polished visualization should help people investigate a system, not create false certainty about it.
A living intelligence platform
OMIKINA combines company strategy, product design, research, data modeling, interface design, geographic visualization, editorial systems, and implementation. Its evidence monitor connects current reporting to the same concepts used throughout the platform while treating automated discovery as an input for review rather than automatic proof.
The project is built for executives, policymakers, communities, researchers, investors, and anyone trying to understand how the global AI economy meets the physical limits of power, manufacturing, construction, water, land, permitting, geopolitics, and public trust.
In the news
Press
Launch announcement ·
OMIKINA launches AI news platform on infrastructure
Read the story across these five US publications.
- CFOtech US Technology news for CFOs and financial decision-makers
- ChannelLife US Industry insider news for technology resellers
- DataCenterNews US Specialist news for cloud and data center decision-makers
- IT Brief US Technology news for CIOs and IT decision-makers
- SecurityBrief US Technology news for CISOs and cybersecurity decision-makers
From the archive
Connected work
Projects, releases, research, and field notes that add detail to this case study.
I Built a Website That Explains—and Tracks—the AI Arms Race
Why the AI race is also a race for chips, data centers, electricity, grids, water, land, equipment, fuel, workers, capital, and public permission—and how OMIKINA makes that system visible.
Read field noteA relevant next step
Trying to make a consequential system legible without hiding uncertainty?
John can help define the evidence model, information architecture, interaction system, editorial boundaries, and technical path for an intelligence product that has to earn trust.